


Abstract
Anabolic androgenic steroids (AAS) are prohibited as performance-enhancing drugs in sports. Among them, testosterone and its precursors are often referred to as “pseudoendogenous” AAS, that is, endogenous steroids that are prohibited when administered exogenously. To detect their misuse, among other methods, the World Anti-Doping Agency-accredited laboratories monitor the steroid profile (concentrations and concentration ratios of endogenous steroids, precursors and metabolites) in urine samples collected from athletes in and out of competition. Alterations in steroid profile markers are used as indicators for misuse of anabolic steroids in sports. Therefore, especially their metabolic pathways with possible interactions are crucial to elucidate. As steroid metabolism is very complex, and many enzymes are involved, certain non-prohibited drugs may influence steroid metabolite excretion. One important group of steroid-metabolizing enzymes is aldo–keto reductases (AKRs). An inhibition of them by non-steroidal anti-inflammatory drugs (NSAIDs), which are neither prohibited nor monitored, but frequently used drugs in sports, was demonstrated in vitro. Thus, this work aims to investigate the influence of NSAID intake on the urinary steroid profile. Kinetic and inhibitory studies were performed using 5α-dihydrotestosterone as substrate. The results obtained from in vitro experiments show that ibuprofen inhibits AKR1C2 and thus influences steroid biotransformation. For in vivo investigations, urine samples prior, during and postadministration of ibuprofen were analyzed using routine methods to monitor the steroid profile. Changes in markers of the steroid profile of volunteers were observed. The combination of in vitro and in vivo results suggests that monitoring of ibuprofen may be useful in doping control analysis. The presented work illustrates the importance to consider co-administration of (non-prohibited) drugs during antidoping analysis. Intake of multiple substances is likely leading to interfering effects. Divergent results in antidoping analysis may therefore be observed and misinterpretation of analytical data may occur. Similar considerations may be appropriate for other fields of forensic applications.
Introduction
Since 2014 the Athlete Biological Passport (ABP) has been used for long-term monitoring of alterations of the intra-individual steroid concentrations in antidoping analysis (1). As several studies report that intra-individual endogenous steroid ratios are very stable over months and even years in adult humans, the ABP is used to detect unphysiological steroid profile alterations. As the intake of pseudoendogenous and some synthetic steroids causes changes in the steroid profile, it is used to detect the misuse of anabolic androgenic steroids (AAS) in doping control (2–4). However, it was recently reported that other (neither prohibited nor monitored) drugs, so-called confounding factors, can influence the steroid profile (5–7). The most frequently used non-prohibited drugs in sports are non-steroidal anti-inflammatory drugs (8). Due to its easy over-the-counter access, ibuprofen may be considered as one of the most commonly used drugs in this class. A previous publication reports that ibuprofen inhibits the aldo–keto reductase 1C2 (AKR1C2) in vitro (9). This enzyme plays a key role in endogenous steroid metabolism (e.g., conversion of potent 5α-dihydrotestosterone (5αDHT) to inactive 5α-androstane-3α,17β-diol (ADIOL)). An inhibition may therefore result in changes in the steroid profile and hence result in a wrong interpretation of the profile that could lead in the worst case to unnecessary but very costly confirmative analyses by gas chromatography coupled to isotope-ratio mass spectrometry (GC–C-IRMS). A study by Ball et al. (10) reports changes in urinary steroid concentrations after administration of ibuprofen to healthy male subjects. Among the examined steroids included in this study (androsterone, etiocholanolone, 11-hydroxyandrosterone, 11-hydroxyetiocholanolone, pregnanediol, pregnanetriol, tetrahydrocortisone and tetrahydrocortisol), only androsterone and etiocholanolone are part of the steroid module of the ABP. Another study reports the influence of ibuprofen on testosterone production and on gene expression of steroid-metabolizing enzymes in vitro and ex vivo (11). The authors report that ibuprofen decreases gene expression of selected steroid-metabolizing enzymes (especially AKR1C2) in vitro and ex vivo. They furthermore report that production of selected endogenous steroids is inhibited in vitro and ex vivo, whereas no significant change in concentrations of examined steroids was detected in vivo in male subjects. As no scientific data on the influence of ibuprofen on all urinary steroids and steroid ratios included in the steroid profile used for antidoping analysis of urine samples collected from male and female athletes are available from literature, this study is intended to close this gap.
The work consists of an in vitro and an in vivo section. In the in vitro study, 5αDHT was incubated as substrate with recombinant human AKR1C2. Reaction was followed spectro-fluorometrically in real time. Stopped incubation broth was stored and analyzed for confirmative reasons on a gas chromatograph coupled to a time-of-flight mass spectrometer (GC–QToF). The second part was an in vivo application trial followed by analysis of urinary steroids included in the steroid profile, using a gas chromatograph coupled to a triple quadrupole mass spectrometer (GC–QQQ).
Materials
Testosterone (T), epitestosterone (E), androsterone (AND), 5αDHT and 17α-methyltestosterone (MeT; used as internal standard) were from Sigma-Aldrich (Milano, Italy). ADIOL, etiocholanolone (ETIO) and 5β-androstane-3α,17β-diol (BDIOL) were from Steraloids (Newport, RI, USA). Deuterated standards T-d3, E-d3, AND-glucuronide-d4, ETIO-d5, ADIOL-d3, BDIOL-d5 were obtained from the National Measurement Institute (Lindfield, NSW, Australia). Ibuprofen, used as inhibitor in the in vitro experiments, was of European Pharmacopoeia (Ph. Eur.) quality and purchased from Caesar & Loretz GmbH (Hilden, Germany). For the in vitro assay solutions of different concentrations of the substrate 5αDHT (3, 7.8, 15, 25, 50, 100 μM, final concentrations in assay) and the inhibitor ibuprofen (0.3, 1, 3, 10, 30, 100, 300, 1,000 μM, final concentrations in assay) were diluted from stock solution prepared by dilution of the solid substance in dimethylsulfoxide (DMSO) in the case of 5αDHT and in ethanol in the case of ibuprofen. Solvents (ethanol, acetonitrile, DMSO, tert-butylmethylether (TBME), methanol or ethyl acetate) and reagents (sodium phosphate and sodium hydrogen phosphate, potassium carbonate and sodium hydrogen carbonate) were of analytical, high-performance liquid chromatography (HPLC) or high-performance liquid chromatography–mass spectrometry (HPLC–MS) grade and were purchased from Merck (Darmstadt, Germany), Carl Roth (Karlsruhe, Germany), Honeywell Fluka (Milan, Italy) or Sigma-Aldrich (Milan, Italy). The cofactor for the enzymatic incubations β-nicotinamide-adenine-dinucleotide-phosphate tetra-sodium salt (NADPH-Na4) was purchased from Carl Roth. The human recombinant enzyme AKR1C2 (expressed in Escherichia coli, catalog number: CSB-EP001543HU) originated from Cusabio (Houston, TX, USA). Phosphate buffer system (PBS, 0.5 M, pH 7.4) from Corning Gentest (Woburn, MA, USA) was used for all in vitro experiments. The preparation of β-glucuronidase from E. coli was from Roche Diagnostic (Mannheim, Germany). The derivatizing agent was a mixture of N-methyl-N-trimethylsilyltrifluoroacetamide (MSTFA)/mercaptoethanol/ammonium iodide (NH4I) (1000:6:4, v/v/w). MSTFA was supplied by Chemische Fabrik Karl Bucher GmbH (Waldstetten, Germany), NH4I and mercaptoethanol were from Sigma-Aldrich. Water was obtained from a “MilliQ” water purification system (Millipore S.p.A., Milano, Italy) or from a water purification system “SG LaboStar” (Guenzburg, Germany).
Methods
All in vitro experiments were performed in triplicate. NADPH solution was prepared freshly 30 min before each experiment. After incubation in the well plate reader, incubation broth was transferred to 0.5-mL reaction tubes, and 200 μL ice-cold acetonitrile was added to denature the protein and end the enzymatic reaction. The tubes were stored at −20°C until analysis on the GC system for confirmative measurements.
Michaelis–Menten constant determination and inhibition pattern
Ethanol (5% (v/v) in final assay), NADPH dissolved in PBS 0.1 M (12 μM in final assay), AKR1C2 (0.28 μM in final assay), PBS (0.1 M, pH 7.4) and ibuprofen (30 μM in final assay in the case of incubations with inhibitor) were added in this order to a 96-well plate. The plate was centrifuged briefly and pre-warmed at 37°C for 3 min in the well plate reader under agitation. The assay was started by addition of 10 μL steroid solution in DMSO at varying concentrations (3, 7.8, 15, 25, 50, 100 μM final concentration of 5αDHT and 5% (v/v) DMSO in assay). Negative control for background correction contained 0.1 M PBS as substitution for enzyme volume. After initiation and brief centrifugation, fluorescence was measured for 1,000 s, in 15-s intervals. A constant temperature of 37°C was assured during the whole measurement cycle. Directly after the measurement, the incubation broth was transferred to 0.5-mL reaction tubes and acetonitrile was added as described previously.
Activity assay
Ibuprofen dissolved in ethanol (5% (v/v) in final assay) at varying concentrations (0.3, 1, 3, 10, 30, 100, 300, 1,000 μM final concentration in assay), NADPH dissolved in 0.1 M PBS (12 μM in final assay), AKR1C2 (0.28 μM in final assay) and 0.1 M PBS were added in this order per well to a 96-well plate. Positive control was prepared by substitution of inhibitor solution with same volume of ethanol. Negative control for background correction contained 0.1 M PBS as substitution for enzyme volume. The assay was started by addition of substrate (15 μM 5αDHT in final assay), fluorescence was measured for 750 s and incubation broth was treated as described previously.
In vivo administration trial
Two volunteers with normal body mass index (one male: 29 years old, 63 kg and one female: 29 years old, 65 kg) received ibuprofen (Brufen® from Abbott) 400 mg daily for 14 days. The volunteers did not take any other drugs during the intervention and sample collection. Urine samples were collected according to the following regime: four urine samples for 5 days before the administration (daily sampling points: 07:00, 13:00, 18:00 and 21:00 h), four urine samples for 14 days during the administration (daily sampling points: 07:00, 13:00, 18:00 and 21:00 h) and one urine sample for 10 days (male volunteer) or 8 days (female volunteer) after the administration (daily sampling point: 13:00 h). All samples were anonymized, collected in sterile plastic tubes and stored at −20°C until analysis. The study was approved by the “Comitato Etico Lazio 1” with the reference number: 1553/CE Lazio 1, and all volunteers approved and signed the informed consent.
Sample preparation—in vitro samples
Internal standard (10 μL of MeT, 0.1 mg/mL) was added to thawed samples. Vials were centrifuged (at 9,660g) to sediment the denatured enzyme and supernatant was transferred to glass tubes. After addition of 1 mL of 0.1 M PBS and 5 mL of TBME, tubes were shaken for 5 min. Organic phase was decanted to new glass tubes after brief centrifugation and freezing of water phase. Solvent was evaporated under nitrogen at elevated temperature. Derivatization solution (50 μL) was added to the dried residues, and derivatization was performed for 30 min at 75°C.
Sample preparation—urine samples
For extraction of endogenous steroids (as free and glucuronide fraction), an already established protocol for steroid profiling of endogenous steroids, which is used routinely in the italian antidoping laboratory, Rome, was used (12–14). In brief, 2 mL of urine, 30 μL of β-glucuronidase, 750 μL of 0.8 M PBS and 50 μL of internal standard (T-d3: 100 ng/mL, E-d3: 25 ng/mL, AND-d4: 200 ng/mL (obtained after hydrolysis of AND-d4 glucuronide), ETIO-d5: 200 ng/mL, ADIOL-d3: 50 ng/mL, BDIOL-d5: 50 ng/mL, MeT: 250 ng/mL) were mixed and heated for 1 h at 55°C. After hydrolysis 500 μL of carbonate/bicarbonate buffer (20% (w/v), pH 9) were added and a liquid–liquid extraction was performed with 5 mL TBME.
The organic phase was transferred to a new vial and solvent was evaporated under nitrogen at elevated temperature. Derivatization solution (50 μL) was added to the dried residues, and derivatization was performed for 30 min at 75°C.
Specific gravity was determined for each urine sample, to normalize steroid concentrations according to the World Anti-Doping Agency (WADA) technical document TD2018EAAS, using a digital refractometer RM40 (Mettler Toledo, Novate Milanese, Italy) (15).
Data analysis—in vitro assay
Equation 1 Fit function used in the program OriginPro to determine the Michaelis–Menten constant of the enzymatic reaction with v: initial velocity, Vmax: maximum velocity, [S]: total substrate concentration and Km: Michaelis–Menten constant.
Equation 2 Fit function used in the program OriginProto determine the IC50 value of the enzymatic reaction, with A1 and A2: bottom and top asymptote; log(x0): center; p: Hill slope.
Chromatographic data (generated on the GC–QToF instrument) of the in vitro investigations were processed using MassHunter Quant for TOF (Version B.09.00, Agilent Technologies, Santa Clara, CA, USA). Quantitation was based on the peak area ratio of the analyte to the internal standard. The calculated concentrations of ADIOL were used to determine initial velocities of product formation. Michaelis–Menten and IC50 curves were generated according to the procedure described.
Steroid profiling in urine samples
Concentrations of endogenous steroids were determined using the routine method used in the italian antidoping laboratory, Rome (12–14). According to the WADA technical document TD2018EAAS, measured concentrations were adjusted for the specific gravity of the urine sample (15). Samples were divided in three groups: before administration of ibuprofen, during administration and after administration. For each volunteer and each substance significant differences between the groups before vs. during and during vs. after were determined separately using significance tests. All data were regarded as independent from each other. Powerful parametric (two-sided t-test or Welch test) or less powerful nonparametric (Mann–Whitney U test) significance tests were applied following the decision tree depicted in online supplementary material 1. Significance levels for Shapiro–Wilk test and F-test were chosen as α = 0.05. To deal with multiplicity problems of statistical tests, Bonferroni adjustment was performed for the significance tests resulting in a total α’ of 0.025 (α’ = α/k; with k: number of performed tests and α: significance level of single tests) (16).
Apparatus
Fluorometer
All fluorometric measurements were carried out on a Tecan Infinite M1000 pro plate reader (Crailsheim, Germany). All in vitro assays were performed in flat black 96-well plates with black bottom (Sarstedt Nümbrecht, Germany). Top reading mode was chosen at an excitation wavelength of 340 nm and an emission wavelength of 450 nm. Excitation and emission bandwidths were set to 5 nm. Measurement temperature was 37°C. All instrumental settings were held stable for the whole experimental timeframe (calibration, Km and IC50 determination). Calibration was performed with different concentrations of cofactor (NADPH) dissolved in 0.1 M PBS. Measured fluorescence intensities were plotted against the concentration of NADPH. The regression curve was tested for linearity (Mandel test), homogeneity of variances at the lowest and highest calibration point (F-test) and outliers (Grubbs test). Limit of quantification (LOQ) was calculated with amplification factor; k = 2 and significance level; VB = 95% according to the requirements of DIN 32 645. A separate calibration including all described tests was performed for the Km determination and for the experiments for IC50 and inhibition pattern determination.
GC–QToF
Instrumental analysis of in vitro samples was performed on an Agilent GC–QToF 7890B/7200 (Agilent Technologies, Milano, Italy), equipped with an Agilent HP1 column (length: 17 m; diameter: 0.2 mm; film thickness: 0.11 μm) with helium as carrier gas. Injection was performed in split mode with a 1:10 ratio at 280°C. The oven program had the following heating rates: 188°C hold for 2.5 min, 3°C/min to 211°C and hold for 2 min, 10°C/min to 238°C, 40°C/min to 320°C and hold for 3.2 min. The coupled QToF was operated in full scan with an ionization energy of 70 eV. Ions were detected from m/z 50 to 750.
Calibration was performed with different concentrations of ADIOL in 0.1 M PBS at fixed concentrations of MeT as internal standard. The measured relative responses ((response ADIOL)/(response MeT)) were plotted against the relative concentrations (c(ADIOL)/c(MeT)). The regression curve was tested for linearity (Mandel test), homogeneity of variances at the lowest and highest calibration point (F-test) and outliers (Grubbs test). A signal-to-noise ratio of at least 10:1 is regarded as LOQ.
Steroid profile measurements on GC–QQQ
A previously described method, which is validated, accredited under ISO17025, and currently used in routine analysis for the detection and quantification of pseudoendogenous steroids in the “Laboratorio Antidoping” of Rome was used (12–14). In brief, analysis was performed on an Agilent GC–MS-MS 7890 A/7000 (Agilent Technologies, Milano, Italy) equipped with an Agilent HP1 column (length: 17 m; diameter: 0.2 mm; film thickness: 0.11 μm). Carrier gas was helium, flow rate 1 mL/min, injection and transfer line temperature were set to 280°C and injection was performed in split mode with a ratio of 1:20. The oven program was as follows: 180°C hold for 4.5 min, 3°C/min to 230°C, 20°C/min to 290°C and 30°C/min to 320°C. The ionization energy was set to 70 eV. Analysis was performed in multiple reaction monitoring mode with transitions used in the reference method (also indicated in online supplementary Table 2). Quantitation of the urinary steroids was based on the peak area ratio of the analyte to the corresponding internal standard. Calibration and quality control samples were prepared in synthetic urine according to previously published methods (17).
Results
In vitro
The Michaelis–Menten constant found in the fluorometric assay (Km = 13.4 μM; standard error of the mean (SE) = 5.6 μM) could be confirmed by the measurements on the GC–QToF instrument (Km = 10.6 μM; SE = 5.9 μM; no significant difference between the two mean values applying two-sided t-test for unpaired data at α = 0.05). For the experiment with addition of constant amounts of ibuprofen (30 μM) as inhibitor of AKR1C2, no significant changes in the Km values were observed, whereas the maximum velocity decreased when ibuprofen was added (Figure 1). This observation was confirmed in both experimental settings (fluorometer: Km = 16.0 μM; SE = 3.1 μM; GC–QToF: Km = 10.7 μM; SE = 1.0 μM).
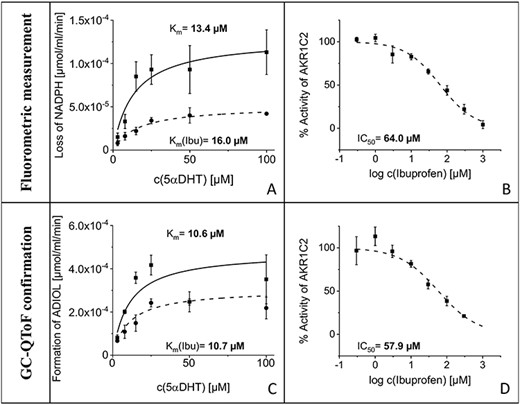
Left column: Michaelis–Menten kinetics with corresponding Km values generated from fluorometric data (A) and the measurements on the GC–QToF instrument (C). Plots without inhibition are depicted with solid lines, plots with constant amount of ibuprofen in assay in dotted lines. Right column: Activity curves with corresponding IC50 values generated from fluorometric data (B) and the measurements on the GC–QToF instrument (D).
IC50 values were similar in the fluorometric assay and the confirmation measurement on the GC–QToF instrument (no significant difference between the two mean values applying two-sided t-test for unpaired data at α = 0.05, data not shown). The obtained IC50 values were 64.0 μM (SE = 8.0 μM) for the fluorometric measurement and 57.9 μM (SE = 5.8 μM) with the chromatographic method. IC50 curves are depicted in Figure 1.
In vivo
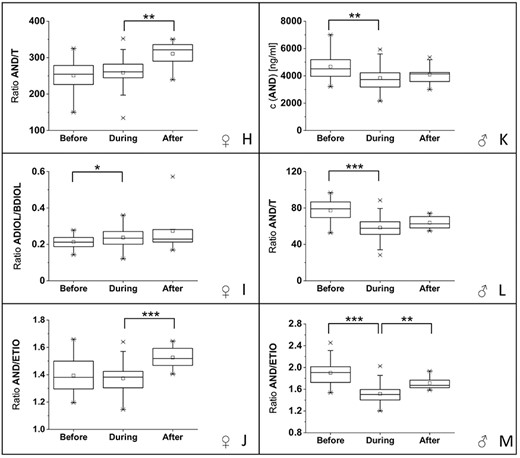
For both volunteers, one male and one female, changes in the steroid profile were detected. For the male volunteer significant changes in the steroid profile were detectable for three steroid profile markers: the concentration of androsterone (AND) and the ratios AND/T and AND/ETIO (boxplots with significance levels in Figure 2K–M). For AND, a significant decrease of 17% (difference in median values; P < 5 × 10⁻³) in the concentration was detected during the administration of ibuprofen compared with pre-administration, whereas no significant difference was detectable between the samples collected during and after the application of ibuprofen. Similarly, the ratio AND/T decreased by 24% (difference in mean values; P < 5 × 10⁻⁴) during the administration of ibuprofen compared with the values before, whereas no significant difference was detectable between the urine samples collected during and after the application. The AND/ETIO ratio decreased by 20% (difference in mean values; P < 5 × 10⁻⁴) during the administration of ibuprofen and showed a significant increase of 13% (difference in mean values; P < 5 × 10⁻³) after the administration of the drug compared with the samples collected during the intake of ibuprofen.
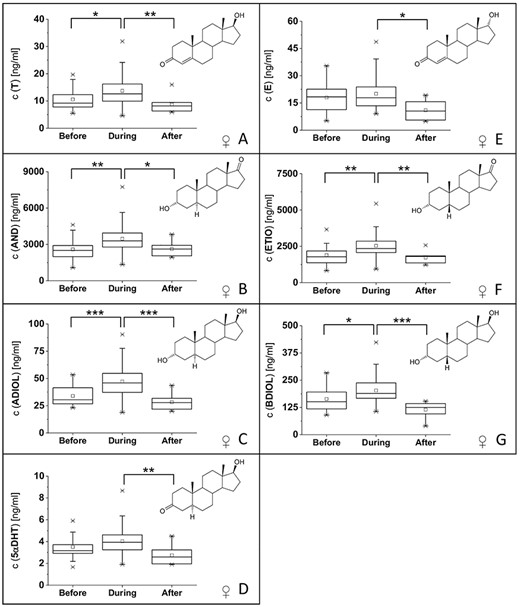
(A–G) Boxplots (including corresponding structures) of urinary steroid concentrations included in the steroid profile (including 5αDHT) from the female volunteer with significant changes between at least two groups. (H–J) Boxplots of urinary steroid concentration ratios with significant changes between at least two groups from the female volunteer. (K–M) Boxplots of urinary steroid concentrations and ratios from the male volunteer with significant changes between at least two groups. Significance levels were set to: significant difference (*) with α’ = 0.025; very significant difference (**) with α’ = 0.005, highly significant difference (***) with α’ = 0.0005.
(Continued)
For the female volunteer, significant changes were detected for all markers in the steroid profile, except T/E and ADIOL/E ratios. Boxplots with the changes in steroid concentrations are displayed in Figure 2A–G. For most steroid concentrations, an increase in the steroid concentration (corrected for the specific gravity) during the intake of ibuprofen is observed as well as a decrease in steroid concentration after the administration of ibuprofen. Boxplots for significant changes in steroid ratios are displayed in Figure 2H–J. An increase of AND/T and AND/ETIO ratios is detectable for urine samples collected postadministration of ibuprofen compared with samples collected during administration. For ADIOL/BDIOL, an increase is detectable between urine samples collected before and during the administration of ibuprofen. P values of all significant differences are reported in online supplementary Table 3.
Discussion
In vitro data
Analysis of the data measured on the GC–QToF instrument show no formation of a steroidal product besides ADIOL in considerable amounts. This ensures that no side reaction is taking place and measured fluorescence intensities of NADPH can be correlated directly with the formation of ADIOL. Hence, it is possible to compare the results obtained by the measurements in the fluorometric assay with data generated on the GC–QToF instrument.
The enzyme assay was developed based on reports from literature (18). Cofactor solution was prepared freshly and always at the same time before starting the assay to eliminate differences in cofactor concentration due to oxidation of NADPH during storage in solution. The cofactor concentration in the final assay guaranteed an excess of cofactor over the whole reaction time. As literature reports different enzyme concentrations used during spectrometric kinetic measurements, the suitable amount of enzyme used in the assay was evaluated experimentally (19, 20). During assay development, different amounts of enzyme were incubated with a high and a low concentration of substrate and stable amounts of cofactor. The lowest tested amount of enzyme, which gave linear signal–time curves (fluorometric measurement) over the whole incubation time for all tested samples, was chosen as enzyme concentration for all further experiments (data not shown). The assay was conducted at 37°C and in a phosphate buffer with pH 7.4 to imitate physiological conditions. Based on preliminary experiments showing better results, when 5αDHT was dissolved in DMSO compared with methanol, DMSO was chosen as solvent for the steroidal substrate in this study. The inhibitor ibuprofen was dissolved in ethanol. To ensure constant assay conditions even if no inhibitor is added, ethanol was added to all experiments in a fixed concentration of 5% (v/v). As known from literature, AKRs catalyze an ordered bi–bi sequential mechanism, where the cofactor binds first (21). Thus, enzymatic reaction was started by the addition of substrate. The intention of this experimental setting was to enable cofactor binding to the enzyme during the pre-warm phase. The time of incubation was adapted to possibly allow long incubation time, whereas the fluorometric signal still results in a linear correlation with the concentration of NADPH. Michaelis–Menten constant was determined to find a suitable concentration of substrate for the inhibition assay (18). The kinetic parameters found in this study are comparable with values reported in literature (online supplementary Table 4). The values depend on the experimental setting and the measurement method. With this in mind, all Km values (in presence and absence of ibuprofen as inhibitor) determined by the two measurement methods have similar values. Furthermore, the maximum velocity (Figure 1, online supplementary Table 4) and turnover number are decreasing in the presence of ibuprofen. Hence, a non-competitive inhibition type is assumed. Thus, the IC50 can be transformed to an inhibition constant (KI), using the Cheng–Prusoff equation (22). The resulting KI values are 64 μM (fluorometric assay) and 58 μM (GC–QToF measurements), respectively. Those values represent the lower therapeutic blood plasma/serum concentration of ibuprofen in human (15–30 μg/mL, corresponding to 73–145 μM (23)). The advantage of using KI values instead of IC50 values is their independence from the substrate but dependence on the enzyme and inhibitor (24). IC50 values often reported in literature are difficult to compare between different laboratories using different substrates. This may explain the difference of the IC50 found in this study (64.0 μM; SE = 8.0 μM for fluorometric measurement and 57.9 μM; SE = 5.8 μM for measurements on the GC–QToF) and literature values (IC50 = 1.9 μM; 9,10-phenantrenequinone as substrate and spectrophotometric measurements) (9).
In vivo data
From the in vitro experiments and knowledge from literature, it was assumed that therapeutic doses of ibuprofen result in inhibition of AKR1C2 in vivo (9, 10). Thus, changes in the steroid profile were expected. In vivo AKR1C2 is known to mainly reduce 3-oxo-steroids to their corresponding 3-hydroxy products (25). Hence, the most obvious assumption was that concentrations and concentration ratios of the steroid profile involving one 3-hydroxy-steroid (AND, ADIOL, ETIO, BDIOL, AND/T and ADIOL/E) are reduced. Unfortunately, the picture is not so clear from the two volunteers in this study. Significant changes in the steroid profile were detectable for both subjects. For the male volunteer, three markers of the steroid profile (AND concentration, AND/T ratio and AND/ETIO ratio) changed significantly, whereas for the female volunteer, nearly all markers showed significant changes (10 out of 12 investigated concentrations or ratios). The alterations in the male steroid profile in the context of a potential case examined during an antidoping analysis may lead to a classification of the profile as atypical. The reduced AND/T ratio can be also used according to literature as a marker of dermal testosterone application. The decrease of AND/ETIO ratio is an indicator of the long-term administration of AAS (7). In conclusion the changes that were observed in the male volunteer represent changes that can also be observed in the context of an antidoping case.
The findings in this study for steroid profile changes induced by ibuprofen in the male volunteer are in agreement with observations from literature, where a decrease in urinary androsterone concentrations were reported for healthy male volunteers, whereas no change in concentration was reported for testosterone and etiocholanolone (10, 11). Another previous publication, where ibuprofen was administered to five male subjects, but only as a single dose, did not show any changes in the steroid profile (26). In conclusion, only repeated administration of the drug leads to changes in urinary steroid concentrations and ratios. Until now, no scientific data have been published on the influence of ibuprofen intake in females. As the steroid concentrations investigated in the steroid profile are much lower in females compared with males, interpretation is more challenging and a lot of factors should be taken in to account when interpreting results (7). It is therefore conceivable that minimal changes in the steroid metabolism may lead to changes in the steroid profile much easier and hence more markers are influenced by ibuprofen intake. For a definitive confirmation of the changes detected in this study in the context of an antidoping scenario, an extension to more volunteers is highly desired.
In the male volunteer, it was shown that ibuprofen and its metabolites are only detectable while ibuprofen is administered (online supplementary material). This influence of ibuprofen can also be observed in the changes in steroid profile. For all three markers of the steroid profile, which are significantly changed during the intake of ibuprofen in the male volunteer, concentrations or concentration ratios are significantly decreasing during the intake (presence) and return in the direction of normal after the intake (absence) of ibuprofen (Figure 2K–M). Due to this fact, we assume that the administration of 400 mg ibuprofen over 14 days has a slightly prolonged effect on the steroid profile in the male volunteer. As this study was performed on two volunteers (one male and one female) and not on a large population, we decided to divide samples into three groups (before, during and after application of ibuprofen). The groups were compared and significant differences between groups were reported.
Conclusion
This study shows the relevance of AKR1C2 inhibition by ibuprofen in vitro and changes in the steroid profile caused by the intake of therapeutic doses of ibuprofen over 14 days for the two volunteers in this study (male and female). This can be an important information when interpreting atypical steroid profiles in the ABP. Atypical profiles could be interpreted more accurately, and costly, time-consuming confirmation methods (e.g., GC–C-IRMS) may be avoided. As these findings are very promising, an administration trial with more volunteers is already in preparation to confirm the relevance of ibuprofen as confounding drug for steroid profiling in antidoping analysis. Furthermore, the evaluation of prolonged effects of ibuprofen administration on the steroid profile and administration of different doses to address the dose dependency of the effects on the steroid profile will be interesting to be evaluated. The knowledge of ibuprofen influencing steroid metabolism may also be interesting in other fields of forensic toxicology.
Supplementary Data
Supplementary data are available at Journal of Analytical Toxicology online.
Funding
World Anti-Doping Agency (16D20FB).
